Command Center
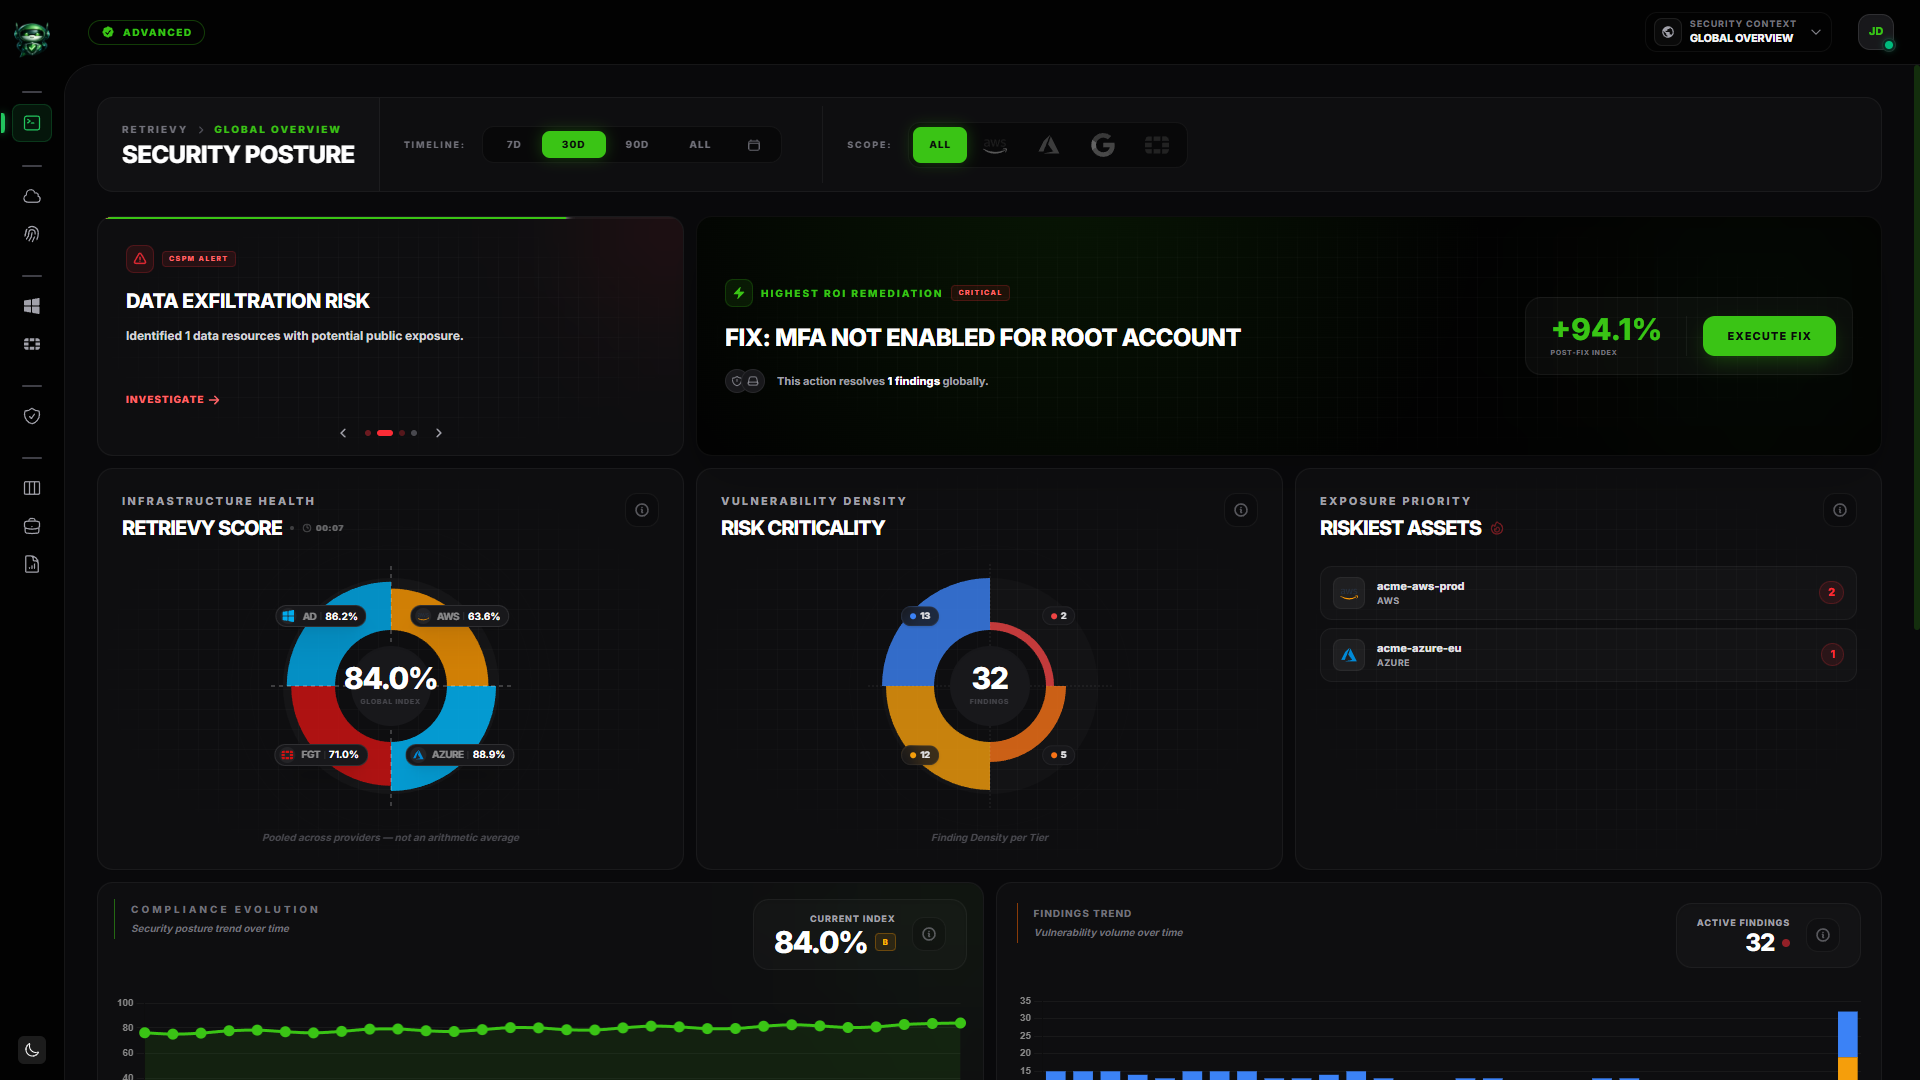
The Command Center is your front page. It's the global view across every module, accessed from the Command Center entry in the left sidebar. The page header reads Security Posture.
It puts your Retrievy Index at the top, the modules that contribute to it in the middle, and the things you should fix next at the bottom. Everything on the page respects the time window and cloud scope you choose with the two filters at the top.
The Command Center is the global view. Each module also has its own dedicated dashboard with deeper drill-downs:
- CSPM dashboard (cloud)
- ISPM dashboard (identity)
- SCM Active Directory dashboard
- SCM FortiGate dashboard
Use the Command Center for an executive view across the whole workspace. Use a module dashboard when you're working inside one specific domain.
Before you start
- A Retrievy workspace.
- At least one data source connected (otherwise the Command Center shows the onboarding wizard instead, see below).
What you'll see
The page header is titled Security Posture. Below it, the layout flows top to bottom:
-
Header strip with the two filters: Timeline and Scope. They scope every card on the page.
-
Onboarding checklist if you still have setup steps pending. Pinned at the top until you complete or dismiss it.
-
Intelligence Carousel. A rotating set of priority alerts (domain alerts, expiring exceptions, aging findings, a short narrative summary of your posture).
-
Highest ROI Remediation. The single fix Retrievy thinks gives you the biggest score lift right now.
-
Offline Agents banner if any of your Windows Agents have stopped heartbeating.
-
Middle row with three cards side by side:
- Compliance Health donut (also labelled with Retrievy Score in this card's header).
- Active Risk severity bars (Critical, High, Medium, Low counts).
- Top Riskiest Assets.
-
Findings trend chart. Historical severity bars with the Retrievy Index plotted as a line over the top.
-
Module slates. Four cards side by side, one per module:
- Post-Scan CSPM (badge: Cloud)
- Post-Scan ISPM (badge: Identity)
- Post-Scan SCM (badge: Infra)
- Policy Hygiene (badge: Hygiene)
Each slate shows the module's finding count, a progress bar, and a status pill.
-
Recent Scans list. Empty if no scans have run yet (shows the message No recent scans).
Filtering the page
Two filters sit in the header. Both scope every card below them.
Timeline
The Timeline: filter has four preset buttons and a calendar icon for a custom range:
| Button | Window |
|---|---|
| 7D | last 7 days |
| 30D | last 30 days |
| 90D | last 90 days |
| ALL | every scan you've ingested |
Click the calendar icon to open the Timeline Calibration modal. Set Start Boundary and End Boundary, then click Sync Calibration to apply.
Scope
The Scope: filter has one button per connected cloud or platform (Azure, AWS, OCI, M365, AD, FortiGate), plus All. Click any one to restrict the page to data from that source.
If you connect a new data source, a button for it appears here automatically once the first scan ingests.
First sign-in: the Goal Selector
If this is your first visit and nobody has set up Retrievy yet, the Command Center replaces itself with a two-step Goal Selector:
- Timezone. Pick your workspace timezone. Scans, reports, and trend charts line up to this.
- Goals. Tick the platforms you want Retrievy to scan: Cloud (any combination of AWS, Azure, GCP, OCI, M365), Active Directory, or FortiGate.
After you save, the Command Center renders with the onboarding checklist pinned at the top. The checklist walks you through connecting credentials, installing agents where needed, and waiting for the first scan.
The checklist stays pinned until you complete every step or dismiss it from the menu. While you're waiting for your first scan to finish, the centre of the page shows Waiting for your first audit with a progress indicator.
When everything is clean
When every connected scan finishes with zero active findings, the Command Center shows the Elite Security Posture card with this message:
Congratulations. No active vulnerabilities or security gaps were detected across your connected infrastructure. Your perimeter is currently optimized and secured.
The Retrievy Index reads 100 and the Risk Items count reads 0. This state is rare in real environments. If you're seeing it, double-check that your scans are completing and not silently failing (see Troubleshooting).
Real-time updates
You do not need to refresh. When a scan finishes, the affected cards update and a confirmation appears.
While the page is recalculating after a filter change, a Synchronizing Data overlay covers the affected cards for a second or two.
How this affects your Retrievy Index
The Command Center doesn't change your Retrievy Index. It shows it. Every number you see on the page reflects the same scoring math described in How the Retrievy Index is calculated:
- The big number at the top is your aggregate Retrievy Index. It rolls up every connected module using the formula.
- The four module slates show each module's own Retrievy Index contribution. Per-module weights affect how much each one moves the global number (see Per-module contributions).
- The Active Risk severity bars are direct inputs into the weighted failure count. Resolving a Critical moves the score more than resolving a Low.
To change your Retrievy Index, work through findings on the Kanban Triage board. Every Resolve Finding or Accept Risk action there reflects on this page within seconds.
Troubleshooting
Symptom: The Command Center shows Waiting for your first audit even though you connected a data source hours ago. → Fix: Check the Recent Scans list. If it's empty or all scans show a failed status, the credential validation probably succeeded but the scanner can't reach your environment. See the integration guide for that data source.
Symptom: The Retrievy Index reads 100 but you know you have findings. → Fix: Open the Scope: filter. You may have a single cloud account selected that genuinely has no active findings. Switch to All to see the global number.
Symptom: A module slate shows zero findings but the Top Riskiest Assets list shows assets from that module. → Fix: Open the Timeline: filter. The slate counts active findings inside the window. The asset list may include older entries. Widen the window to ALL to confirm.
Symptom: The Command Center renders but the cards never update with new scan data, and you do not see any confirmations. → Fix: Reload the page to force a sync. If updates still do not arrive automatically, your network or corporate proxy may be blocking the connection Retrievy uses for live updates. The page will still refresh on its own every few minutes as a fallback. Ask your network team to allow outbound HTTPS to your Retrievy workspace domain.