CSPM dashboard
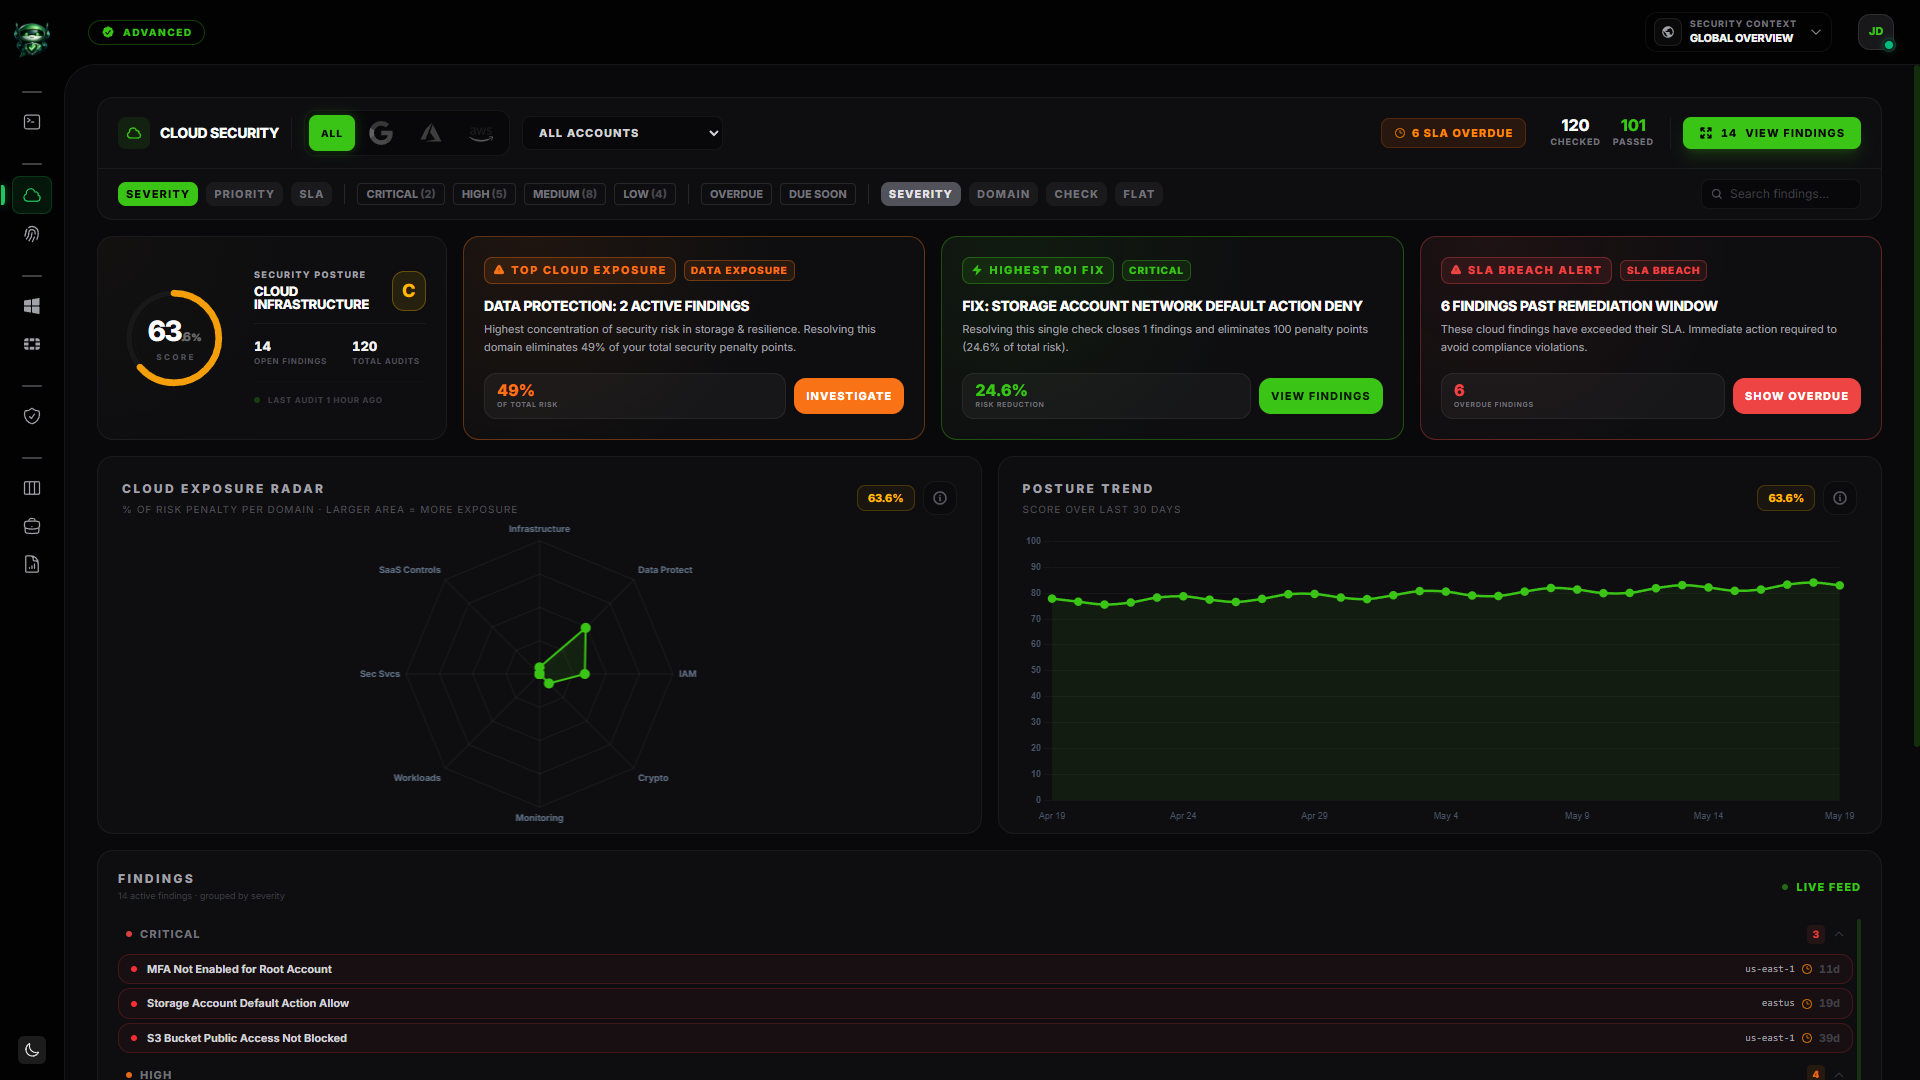
The CSPM dashboard is the per-module view of your Cloud Security Posture Management posture. It scopes the data on the Command Center down to cloud findings (AWS, Azure, GCP, OCI, M365) and adds drill-downs you don't get on the global page.
The page header reads Cloud Security. You'll find it under the CSPM entry in the navigation. The page is available on plans that include the CSPM module (see plan feature matrix).
Before you start
- A workspace with at least one connected cloud account (see Connect an AWS account).
- Permission to read CSPM findings. In Settings → Roles & Permissions, your role needs either the View all CSPM findings across all cloud accounts toggle or its scoped counterpart, under the CSPM (Cloud Security) group. Without one of these the CSPM nav entry is hidden.
- For per-account drill-down, you also need the cloud account assigned to your role (when scoped).
What you'll see
The page flows top to bottom:
- Header strip with the Provider selector (All, AWS, Azure, GCP, OCI, M365) and the Account dropdown. The header also surfaces an
<N> SLA Overduebadge when any findings have breached their SLA. - Per-module Retrievy Index hero. A circular gauge with the score as a percentage (for example
87.3%), a letter grade (A through F) in a coloured box, plus two KPI tiles: Checked (total audits performed) and Passed (audits that passed). A small footer reads Last audit <time> ago with a live pulse indicator. - Top KPI strip. Four numbers: Checked, Passed, Open Findings, Total Audits.
- Cloud Exposure Radar. An 8-axis radar visualising risk penalty distribution.
- Filters row above the findings feed (sort, severity chips, SLA chips, group-by, search).
- Findings feed. The current cloud findings, grouped by your selected dimension.
Cloud Exposure Radar
The radar plots eight cloud-security domains, in order:
Infrastructure · Data Protect · IAM · Crypto · Monitoring · Workloads · Sec Svcs · SaaS Controls
Each axis shows the percentage of risk penalty that domain contributes to your overall CSPM score. The larger the area on the radar, the more exposure your environment carries in that domain. The chart subtitle reads % of risk penalty per domain · larger area = more exposure.
Hover any axis for a tooltip in the form <N>% of risk penalty.
The radar is purely a distribution view. A small lopsided shape on the IAM axis tells you most of your CSPM risk weight is concentrated in identity misconfigurations. A balanced octagon tells you your risk is spread evenly across domains.
An info modal next to the radar title explains the calculation and what each domain covers, in case the team wants to dig deeper.
Provider and Account filters
The two filters at the top scope every card and the radar:
| Filter | Options |
|---|---|
| Provider | All, AWS, Azure, GCP, OCI, M365 (icon row). |
| Account | All Accounts by default, then one entry per connected account in the selected provider. |
When you switch provider or account, the radar redraws, the KPIs update, and the findings feed re-filters. If the new selection has no findings, the page shows a small "no findings for this filter" notice rather than the full empty state.
Findings feed
The bottom of the page is your findings feed. The same toolbar that lives above the Hardening Kanban list view is here, with these controls:
- Sort: Severity, Priority, SLA.
- Severity chips: Critical (N), High (N), Medium (N), Low (N). Click any chip to toggle the filter.
- SLA chips: Overdue and Due Soon.
- Group By: Severity, Domain, Check, Flat.
- Search: a free-text box with the placeholder Search findings....
- Clear: resets every filter on the page.
Click any finding row to open the same detail drawer used on the Kanban. Click the View Findings button in the top-right of the page to open the full findings list in a modal overlay with the page's current filters pre-applied. The modal is the same list the Kanban uses, so column layout, density, and bulk actions all behave identically.
Real-time updates
When a CSPM scan completes, the dashboard refreshes on its own. A toast at the bottom reads <account-label> scan completed. Cloud findings updated. The score gauge, KPIs, radar, and findings feed all recompute live. You do not need to refresh.
If the page does not update after a known scan, reload it to force a sync.
Empty states
| Condition | What the page shows |
|---|---|
| You've connected an account but no scan has finished | Zero Data / Synchronized with the message Your cloud perimeter is connected but hasn't been evaluated. Configure or run your first scan from Settings → Cloud Accounts. Includes a Configure Cloud Accounts button. |
| Scans have completed and every finding is resolved or accepted | Elite / Security Posture with the message Cloud posture is hardened. No open security gaps or cloud-based vulnerabilities found across your connected accounts. Includes a Manage Cloud Accounts button. |
What is NOT on this page (intentional)
A few things you might expect that live elsewhere:
- No per-provider score cards. The provider filter scopes everything, but there isn't a "AWS: 84 / Azure: 71 / GCP: 92" comparison panel on this page today. Switch the Provider selector to compare.
- No Scan Now button on the dashboard. Scans are dispatched from Settings → Cloud Accounts. The dashboard is for posture state, not scheduling. If a cloud account never produced findings, the empty state's Configure Cloud Accounts link takes you straight there.
- No PDF export from this dashboard. Use the Reports module for the Executive or Technical PDF.
How this affects your Retrievy Index
The CSPM per-module score on this page is the same number that feeds the global Retrievy Index on the Command Center. Per-module weight is 5.0 (the default). Every Critical, High, Medium, or Low finding you see here contributes to the weighted failure count, which is then divided by the scaled audit size to produce the score. The full math is in How the Retrievy Index is calculated.
To raise the CSPM score, work findings down on the Hardening Kanban or move them into a Remediation Project.
Permissions
Every toggle below lives in Settings → Roles & Permissions, under the group named in the second column.
| Toggle | Group | What it grants |
|---|---|---|
| View all CSPM findings across all cloud accounts | CSPM (Cloud Security) | The dashboard with every connected account visible. |
| View CSPM findings only for assigned cloud accounts | CSPM (Cloud Security) | The dashboard, restricted to the cloud accounts assigned to the role. |
| Move cards and manage Kanban workflow | Kanban Board | Per-finding state changes (resolve, accept risk) from the detail drawer. |
| Approve, reject, and manage security exceptions | Security Exceptions | Creates an exception via the Accept Risk action on the drawer. |
The CSPM module also needs to be included on your plan; see plan feature matrix. Workspace admins have every permission by default.
Troubleshooting
Symptom: Switched Provider to Azure but the radar reads the same as All. → Fix: Reload the page. If the radar still does not redraw on filter changes, your network may be blocking the dashboard's live updates. Reloading forces a fresh read.
Symptom: The hero card shows a score of 100 and Elite Security Posture even though I know I have findings. → Fix: Your account filter or provider filter is hiding them. Open the Provider selector and click All, then the Account dropdown and pick All Accounts.
Symptom: The Cloud Exposure Radar is empty / a tight point in the centre. → Fix: Either you have no findings on the selected provider, or every finding maps to a domain not in the eight on the radar (rare). Click All in the Provider selector to confirm.
Symptom: I see a CSPM finding on the Command Center that doesn't appear on this dashboard. → Fix: Your CSPM dashboard scope and the Command Center scope are independent. The Command Center may be on All Accounts while the CSPM dashboard is filtered down. Switch both to All to reconcile.
Symptom: View Findings opens the modal but it's empty. → Fix: The modal inherits the page's filters. If your severity chips have everything but Low de-selected and the only matches are Low, the modal will appear empty. Click Clear to reset.