SCM FortiGate dashboard
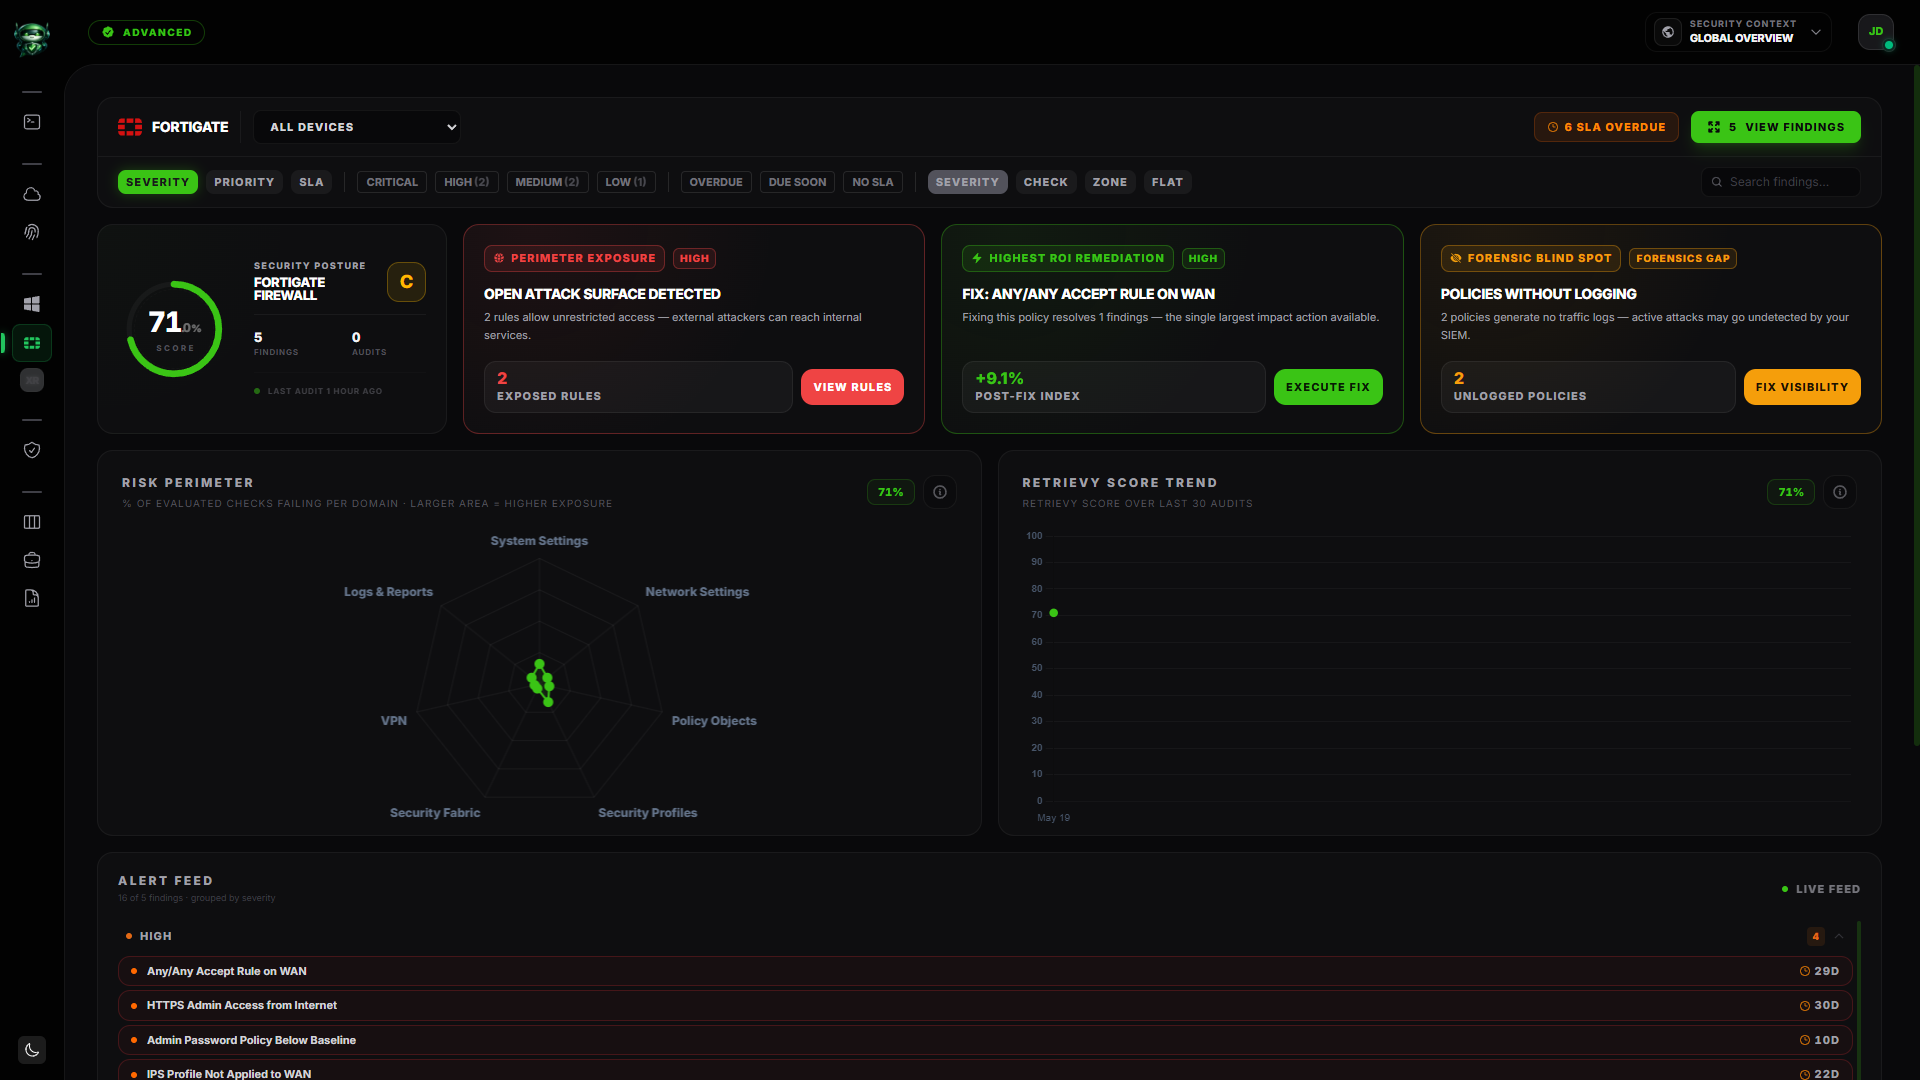
The SCM FortiGate dashboard is the per-device view of your FortiGate firewalls. It pulls in both CIS-benchmark admin-plane checks and Layer-7 efficacy checks for SSL inspection, AV, IPS, AppControl, WebFilter, DNS, and DLP. The deep cleanup features (Policy X-Ray with Domino Effect and the Hygiene Engine for zombie rules) live in a dedicated sub-page accessed from this dashboard.
The page header reads FortiGate. It lives under SCM in the navigation. The page is available on plans that include the SCM module (see plan feature matrix).
Before you start
- At least one FortiGate device connected. Today, FortiGate is reached from a Retrievy Agent (either the Windows MSI or the Docker container) using SSH and the FortiGate REST API. The agent acts as a proxy from your network to Retrievy.
- Read-only API credentials on the FortiGate device for the agent to authenticate with.
- Permission to read FortiGate findings. In Settings → Roles & Permissions, your role needs either the View all FortiGate findings toggle or its scoped counterpart, under the FortiGate group.
If no FortiGate device has been scanned yet, the dashboard shows the empty state described below with a pointer to the agent install.
What you'll see
Same skeleton as the other module dashboards:
- Header strip with the Device dropdown (defaults to All Devices) and an account picker if you have multiple connected FortiGate fleets.
- Per-module score hero. Percentage gauge with letter grade, Checked and Passed tiles, Last audit <time> ago footer.
- Top KPI strip. Checked, Passed, Open Findings, Total Audits.
- Risk Perimeter Radar. A 7-axis radar over the CIS FortiGate sections (described below).
- Findings feed with the standard toolbar (sort, severity chips, SLA chips, group-by, search, clear).
Risk Perimeter Radar (7 CIS sections)
The radar plots the seven CIS FortiGate benchmark sections:
| Axis | What it covers |
|---|---|
| System Settings | Admin access, NTP, DNS, password policy, banner, SNMP, host config. |
| Network Settings | Interfaces, routing, NAT, DHCP, virtual IPs. |
| Policy Objects | Address objects, services, schedules, scope objects. |
| Security Profiles | The Layer-7 efficacy profiles (SSL inspection, AV, IPS, AppControl, WebFilter, DNS filter, DLP). |
| Security Fabric | Fabric connectors, automation triggers, fabric-wide settings. |
| VPN | IPsec and SSL-VPN configuration. |
| Logs & Reports | Logging targets, retention, alert routing, syslog. |
The radar tooltip reads % of evaluated checks failing per domain · larger area = higher exposure. The larger the area on an axis, the more concentrated your FortiGate risk is in that section.
What gets checked
Two distinct check banks contribute to your findings:
- 28 admin-plane CIS checks covering the System Settings, Network Settings, Policy Objects, Security Fabric, VPN, and Logs & Reports sections.
- 45 Layer-7 efficacy checks covering the Security Profiles section. These look at whether SSL inspection is actually enabled on a policy, whether AV scanning fires on every protocol you'd expect, whether AppControl categories are blocked rather than just monitored, and similar real-world efficacy questions.
The dashboard doesn't surface individual checks as filter chips (there are too many). Use the search box on the findings feed to filter by rule name.
Device scope
The header dropdown defaults to All Devices. Open it to scope the page to a single FortiGate. If you have multiple devices in different sites, each appears as its own entry once the agent has scanned it.
The device list is populated automatically; no manual configuration in the Retrievy UI is required to add a device once the agent has its credentials.
Drilling into Policy X-Ray and the Hygiene Engine
The Policy X-Ray sub-dashboard is a separate page accessed from the SCM section of the sidebar. It's where the heavy operational analysis lives. Three tabs at the top:
- X-Ray Analysis is the policy-dependency chain. Select a single policy and the page draws every downstream Layer-7 check that depends on it. The classic example: if SSL inspection is broken on a policy, AV, IPS, AppControl, WebFilter, DNS filter, and DLP all silently fail on traffic that passes through that policy. The Domino Effect visualisation makes that cascade obvious.
- Hygiene & Cleanup is the Hygiene Engine. It flags zombie rules (policies that haven't matched traffic in your retention window), unused address and service objects, and shadowed rules (rules that can never fire because an earlier rule already matched). Two view modes: an action-list view for cleanup work, and a matrix view that shows the policy table with hygiene flags overlaid.
- Drift History is the historical change log for the device. Every config change Retrievy detected between snapshots shows up here with old value, new value, and timestamp. You can export the last seven days as CSV or PDF (see Reports → Drift export).
For the full walkthrough, see FortiGate Policy X-Ray. It covers The Domino Effect, Hygiene & Cleanup, Asset Criticality, and Drift History.
Findings feed
Same toolbar as the other module dashboards. Severity chips show the active counts. The search box accepts free text from finding titles and rule names.
Click any finding for the standard drawer. View Findings opens the full findings modal.
Real-time updates
When the agent finishes a FortiGate scan, this dashboard updates in place with a toast announcement. Score, KPIs, radar, and findings feed all recompute live.
Empty states
| Condition | What the page shows |
|---|---|
| No FortiGate device has been scanned yet | Your network security perimeter has not yet been audited. Add a FortiGate device and assign a Windows Agent to analyze firewall hardening and security gaps. |
| Scans have completed and every finding is resolved or accepted | Your FortiGate firewalls are hardened. No open security gaps or misconfigurations found across all evaluated security policies. |
What is NOT on this page (intentional)
- The Policy X-Ray, Drift, and Hygiene Engine all live on the dedicated Policy X-Ray sub-page, not inline here. This dashboard is the per-device posture summary; the cleanup work happens on the sub-page where there's room for the full policy table and the dependency chain visualisation.
- No per-check filter chips. There are 73 checks (28 admin-plane plus 45 Layer-7); the dashboard would be unusable with them all. Use the search box.
- No Scan Now button. Scans run on the agent's schedule or via Fleet → Agents → <agent> → Scan Now.
- Drift Alerts are not surfaced on this dashboard. They live on the Policy X-Ray Drift tab and are exportable from there.
How this affects your Retrievy Index
FortiGate findings contribute to your global Retrievy Index through two SCM sub-modules with different weights:
- SCM FortiGate CIS (the 28 admin-plane checks): per-module weight 5.0 (default).
- SCM FortiGate Policies (the 45 Layer-7 efficacy checks): per-module weight 4.0, slightly more sensitive because operational policy issues carry more individual weight than a CIS benchmark gap.
See Per-module contributions for how this rolls into the global score.
Permissions
Every toggle below lives in Settings → Roles & Permissions, under the group named in the second column.
| Toggle | Group | What it grants |
|---|---|---|
| View all FortiGate findings | FortiGate | The dashboard with every connected FortiGate device visible. |
| View FortiGate findings only for assigned devices | FortiGate | The dashboard, restricted to the FortiGate devices assigned to the role. |
| Move cards and manage Kanban workflow | Kanban Board | Per-finding state changes from the drawer. |
| Approve, reject, and manage security exceptions | Security Exceptions | Creates an exception via the Accept Risk action. |
The SCM module also needs to be included on your plan; see plan feature matrix. Workspace admins have every permission by default.
Troubleshooting
Symptom: The dashboard shows the empty state even though the agent is Online and the FortiGate credentials look correct.
→ Fix: Confirm the agent can reach the FortiGate on its API port. From the agent host: curl -k -I https://<fortigate-ip>/api/v2/cmdb/system/status should return an HTTP response. If it times out, your network is blocking the path. SSH separately to confirm the device is reachable: ssh <fortigate-admin>@<fortigate-ip>.
Symptom: Several Security Profiles findings show as Critical but the Security Profiles axis on the radar is small. → Fix: The radar shows the percentage of checks failing per section, not the severity of failures. A few high-severity failures in Security Profiles produce a small axis if the section has many total checks (45 Layer-7 checks). The KPI strip and the findings feed give you the severity picture; the radar gives you the distribution picture.
Symptom: The Last audit timestamp is recent but the findings list looks stale. → Fix: The agent re-runs the scan but the FortiGate API may not have returned every section in the last cycle (timeouts on large config dumps). Run Scan Now from Fleet → Agents → <agent> → Scan Now to force a fresh full cycle.
Symptom: Drilled into Policy X-Ray, selected a policy, and the Domino Effect chain looks empty. → Fix: The chain only renders for policies that actually have downstream dependencies (Layer-7 profile bindings). A policy with no security profiles attached has no domino effect. Pick a policy with at least one of the seven profile types bound.