Audit trail
The audit trail is the tenant-wide forensic record of who did what, when, and from where. Every audited write to your workspace lands here within a second, and the page streams new entries live while you read.
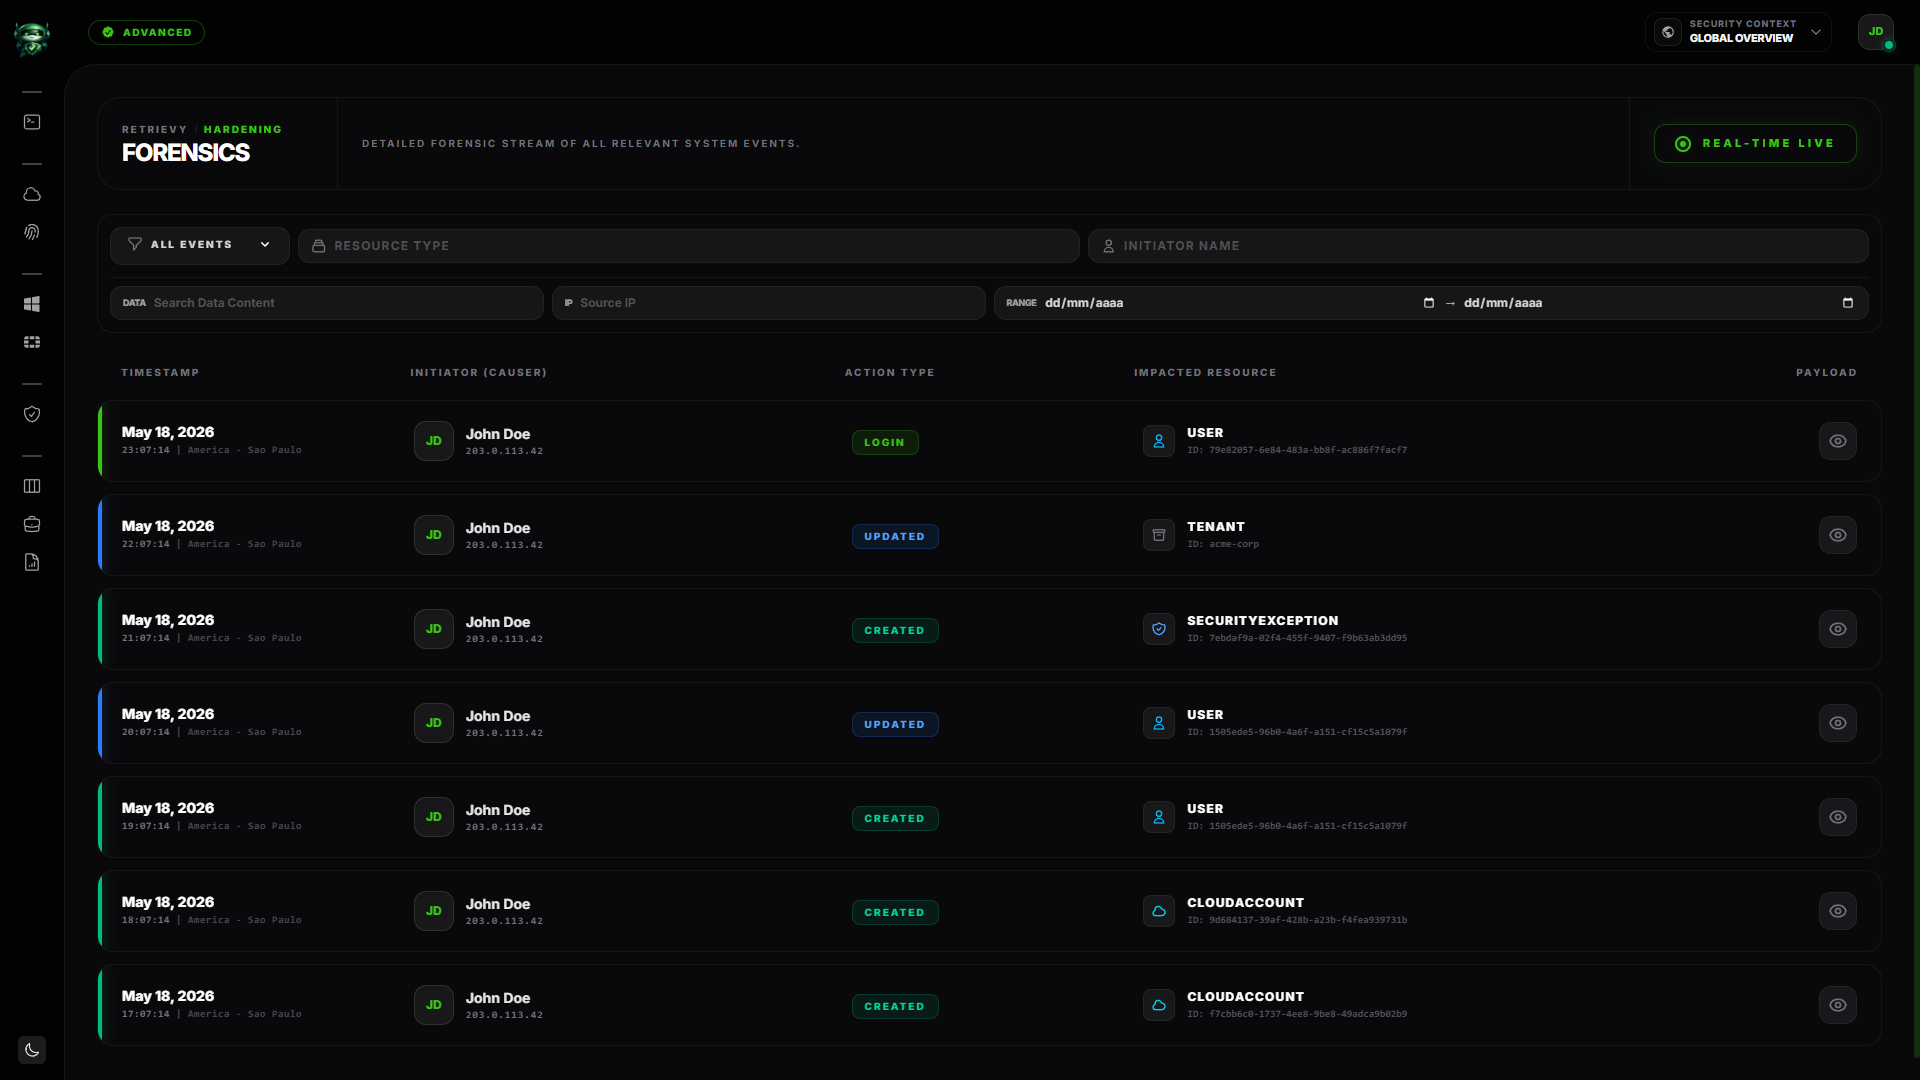
Open Settings → Audit Trail. The page is titled Forensics under the Retrievy / Hardening breadcrumb. A pulsing green Real-time Live chip in the top-right confirms the stream is connected.
Before you start
- The View tenant audit logs permission (under the Audit Trail group in Settings → Roles & Permissions). Without it the nav entry is hidden and direct URL access returns 403.
- A workspace on a plan that includes the Detailed Audit Trail feature. See plan availability below.
Plan availability
The audit trail is included on the Advanced plan and on every Build Your Own plan. The Essentials plan does not include it, and audited writes are not recorded while the feature is off. See the plan feature matrix for the full grid.
When the feature is off:
- The Settings → Audit Trail nav entry is hidden.
- The Audit Trail permission group does not appear in the role builder.
- No new audit records are written, even for events that would normally be captured.
Upgrading turns recording on for future events. The audit table is not back-filled with events that happened during the off period.
Where to find it
Open the left sidebar and click Settings → Audit Trail. The direct route is /settings/audit-trail under your tenant subdomain. If the entry isn't visible, your role doesn't carry the View tenant audit logs permission or the plan doesn't include the feature.
What gets logged
The audit trail captures three families of events.
Model changes
Every create, update, delete, or restore on these resources is recorded with a full before-and-after diff:
- Cloud accounts (every connected provider).
- FortiGate device connections.
- Findings (vulnerability records).
- Security exceptions.
- Remediation projects and their items.
- Tenant users and their role assignments.
- Pending team invitations.
- Sites and tags.
Credential fields (API keys, secrets, encrypted SSH passwords) are stripped before the diff is stored. The diff shows attribute names and non-sensitive values only.
Role and permission changes
The Roles & Permissions page emits dedicated events when a role is created, when its permission set is updated, and when it is deleted. The diff captures the full permission list before and after.
Authentication events
The audit trail also records:
- Successful Login (including the auth provider when SSO is involved).
- Logout.
- Auth Failed attempts (IP and user agent only, never the submitted credentials).
A short de-duplication window keeps repeated framework-level emissions from flooding the log (10 seconds for login and logout, 5 seconds for failed authentication from the same IP).
The audit log table
Each row is a single event. The desktop layout has five columns:
| Column | What it shows |
|---|---|
| Timestamp | Date and time of the event, rendered in your workspace timezone with the zone name appended (for example BRT - Sao_Paulo). |
| Initiator (Causer) | The user who performed the action, with their initials avatar and the source IP underneath. System-emitted events show System Process in place of a user. |
| Action Type | A colored badge naming the event: Created, Updated, Deleted, Restored, Permissions, Revoked, Token Rotated, Login, Logout, or Auth Failed. |
| Impacted Resource | The resource type with a category icon, plus the resource ID below it (selectable for support tickets). |
| Payload | An eye icon button that opens the State Comparison modal. |
A 1-pixel colored bar on the left edge of each row mirrors the badge color, so you can scan a long list for a specific event type without reading every row.
The table paginates at 20 rows per page. Pagination controls appear at the bottom when there are more results than fit on one page.
State comparison modal
Click the eye icon on any row to open the State Comparison modal. It shows two panels side by side: Previous Attributes in red on the left, Updated Attributes in green on the right. Both render the raw attribute keys and values that the event recorded. Nested objects are flattened to { Object } on the previous side and pretty-printed on the new side.
If the event has no prior state (a creation event, for example), the left panel reads No prior state recorded. If it was a deletion with no replacement, the right panel reads Resource fully purged.
Close the modal with the X button, the Escape key, or Close Forensic View at the bottom.
Filters and search
The filter bar at the top of the page combines a dropdown, three text inputs, and a date range.
All Events dropdown. Pick one of:
- All Events (default).
- Created, Updated, Deleted, Restored.
- Permissions, Revoked, Token Rotated.
- Login, Logout, Auth Failed.
Resource Type. Free-text match against the impacted resource class (case-insensitive substring). Type vulnerability, cloudaccount, role, user, and so on.
Initiator Name. Free-text match against the causer's display name. Searches active users; system-emitted events (with System Process in the column) are excluded from this filter.
Search Data Content. Substring search across both the previous-state and new-state attribute payloads. Use it to find audits that mention a specific cloud account name, a finding ID, or a hostname.
Source IP. Substring match against the request IP recorded on each event. Useful when investigating activity from a specific egress.
Range. Two date pickers. Both interpret the picker value in your workspace timezone, then convert to UTC for the lookup, so picking May 1 → May 7 in America/Sao_Paulo captures everything that happened between 00:00 BRT on May 1 and 23:59:59 BRT on May 7, not the UTC interpretation of those dates.
Filters apply together (AND). The page reloads results as you type. While the query runs, a translucent overlay shows Analyzing above Forensic Audit Stream.
Empty state
When no events match your filters, the page shows the Silence in the Logs empty state with the message No activities match your current security filter criteria. and a Clear all filters button that resets the event dropdown. Clear the text and date filters by hand.
Real-time updates
When a new event happens while you're on the page:
- It slides into view at the top of the list with a brief swipe animation.
- The row is highlighted with a green border for five seconds, then settles into the regular list.
- The Real-time Live chip stays pulsing while updates are flowing.
You do not need to refresh. Under heavy scan load, new rows may appear a few seconds after the underlying action.
Retention
Audit rows are kept in your workspace without a time-based purge. The retention controls that apply to scans, snapshots, and drift events do not delete audit rows.
Each resource keeps its last 200 audit entries. When a resource accumulates a 201st audit, the oldest entry for that resource is dropped. The cap is per-resource, not workspace-wide, so a workspace with many resources accumulates many more than 200 audits in total.
If you need longer-term archival (compliance evidence, breach investigations), export rows of interest before they roll past the per-resource cap. Today the page does not have a CSV export button; capture the State Comparison modal as a screenshot, or open a support ticket with the audit IDs you need preserved.
Permissions
Two access controls gate this page.
Role permission. The View tenant audit logs toggle, under the Audit Trail group in Settings → Roles & Permissions, grants read access to the page and the underlying records. There is no separate write permission because the audit log is append-only. The toggle is hidden when the plan does not include the Detailed Audit Trail feature.
Plan feature. The Detailed Audit Trail feature must be active on the workspace's plan, otherwise the route returns 403 and no new entries are recorded.
The tenant-admin role carries every permission by default, including this one. Custom roles must be granted it explicitly.
How this affects your Retrievy Index
The audit trail is read-only governance. Viewing it, filtering it, or opening the State Comparison modal does not change any finding, exception, or remediation status, and it does not move your Retrievy Index. The actions that show up in the audit trail (accepting risk, revoking an exception, deleting a cloud account, rotating a token) are scored where they happen. The audit trail records the fact; it does not weight it.
For the rules that do move the score, see the Retrievy Index overview and the scoring rules catalog.
Troubleshooting
Symptom: The Settings → Audit Trail nav entry isn't visible. Fix: Check two things in order. First, the workspace plan must include the Detailed Audit Trail feature; the entry is hidden on Essentials. Second, your role must carry View tenant audit logs. Ask a workspace admin to verify both.
Symptom: Opening /settings/audit-trail directly returns a 403 page.
Fix: Same root causes as the hidden nav entry. The route enforces the plan feature first and the role permission second.
Symptom: I changed a setting two minutes ago and it's not in the audit log. Fix: Three checks. First, the plan must have been on Advanced or Build Your Own at the time of the change; audits are not back-filled if the feature was enabled after the fact. Second, some fields are excluded from auditing on purpose (credential payloads, internal scan bookkeeping); a write that touches only excluded fields is suppressed to avoid empty rows. Third, audit rows can arrive a few seconds late during a busy scan window. Refresh the page to force a re-query.
Symptom: The diff shows attribute keys I don't recognise. Fix: The modal shows the raw stored attributes for the affected record, which sometimes includes internal identifiers Retrievy uses to wire one record to another. Read the Action Type badge and the Impacted Resource column for plain-language context, and treat the diff as the authoritative record of what changed.
Symptom: The same login event appears twice within a few seconds. Fix: A 10-second de-duplication window already collapses repeated logins for the same user. If you still see duplicates, they are likely from two different sessions (for example a browser tab and the mobile-web app). Compare the Source IP column to confirm.
Symptom: Many Auth Failed rows from one IP in a short window. Fix: That IP is being rate-limited (only the first attempt within a 5-second window per IP is recorded). Investigate the source as a possible brute-force attempt. Block the IP at your egress or enforce SSO under Settings → SSO.
Symptom: The Real-time Live chip is showing but new events never appear without a refresh. Fix: The browser tab lost its live connection. Refresh the page; the indicator should re-establish. If the issue persists, ask your network team to allow outbound HTTPS to your Retrievy workspace subdomain.